Prometheus Metrics
Prometheus is an open-source application that collects and stores metrics as time series data. This data can be visualized with applications such as Grafana. Both Prometheus and Grafana are applications that are deployed separately from NETLAB+.
NETLAB+ provides several Prometheus exporters; node exporter, NETLAB+ exporter, and nginx. Node exporter provides access to system level metrics. The NETLAB+ exporter provides metrics specific the NETLAB+ application. Prometheus collects and stores its metrics as time series data. Prometheus data can then be visualized with Grafana. Prometheus and Grafana are applications that are deployed separately from NETLAB+. This feature satisfies HECVAT On-Prem OFID-05 for remote monitoring.
In the subsections below, we will configure exporting of system metrics to Prometheus and Grafana.
Configure Exporter
Note
An exporter exposes one or more URLs from which Prometheus can scan for metrics. One or more metric exporters can be bound to a listener port. The exporter types are:
node_exporter: Collects metrics for the operating system and kernel.
netlab: Collects metrics pertaining to NETLAB+.
nginx: Collect metrics for the web server
Perform the following steps to configure an exporter.
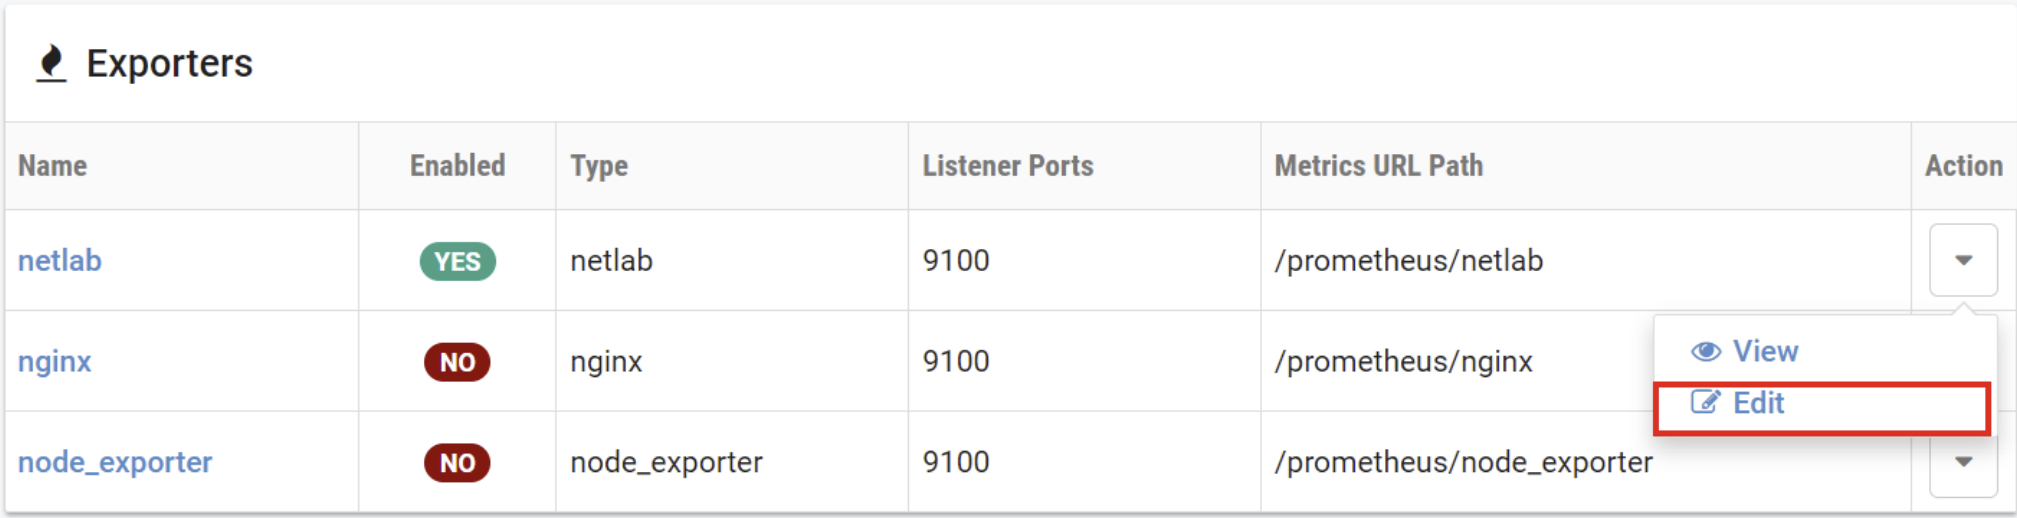
Go to Security > Admin > Prometheus Metrics.
To view the settings of an exporter, select the Action dropdown button on
the row of the Exporters table and select Edit.
The Exporter Edit page will be displayed. Edit the values on the page as
appropriate (refer to the field descriptions below), and then click Submit.
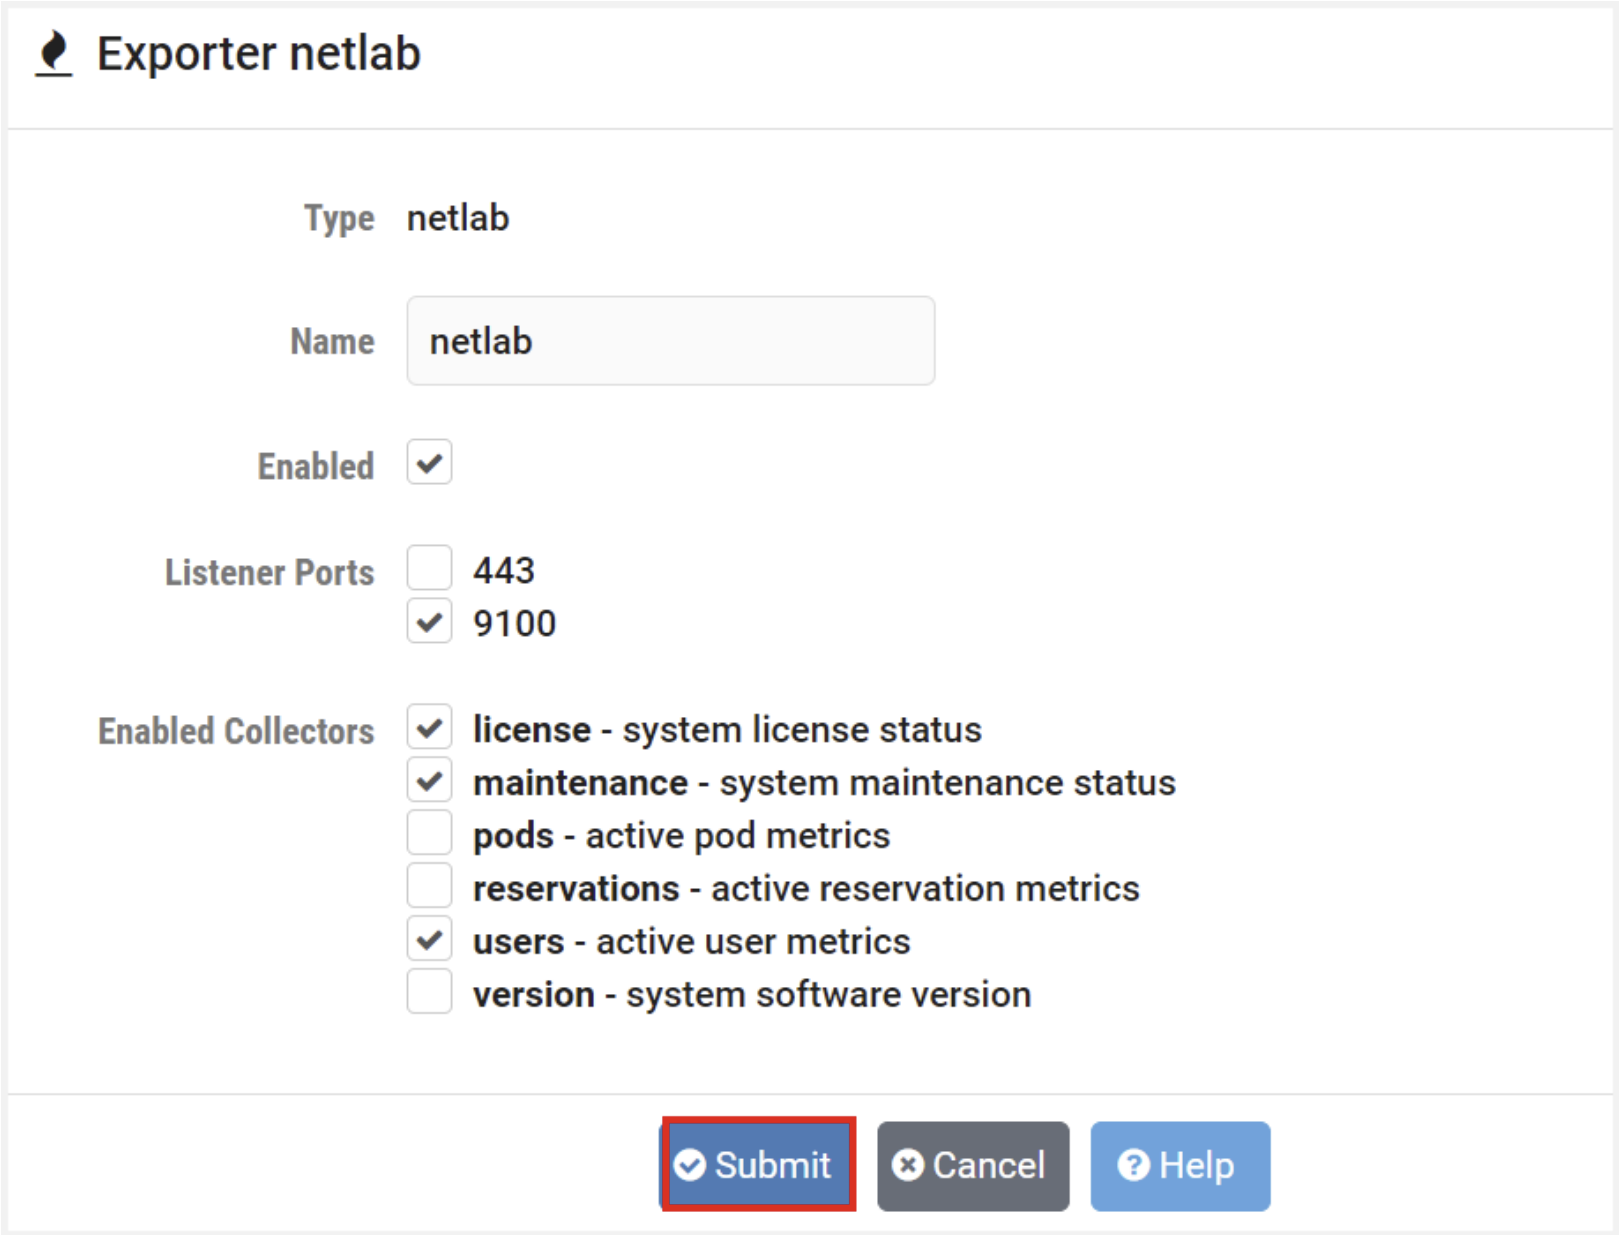
Field Descriptions – Exporter Edit
- Type:
Specify the type of exporter (node_exporter, netlab, nginx).
- Name:
Exporter name can contain lowercase ASCII letters (a-z) and numbers (0-9), and must start with a lowercase ASCII letter (a-z).
- Enabled:
Check to enable this exporter.
- Listener Ports:
The TCP port numbers that this exporter will be enabled on.
- Enabled Collectors:
A collector is part of an exporter that represents a set of metrics.
License: System license status
Maintenance: System maintenance status
Pods: Active pod metrics
Reservations: Active reservation metrics
Users: Active user metrics
Configure Listener Ports
Note
A listener port is a TCP port that can accept a connection from Prometheus. One or more metric exporters (that have been enabled and configured as per the previous section) can be bound to a listener port.
Port 9100 is recommended if your Prometheus server is located inside your site firewall.
Port 443 (the standard HTTPS port) can be used for a Prometheus server residing outside the site firewall, without opening an additional dedicated port through the firewall.
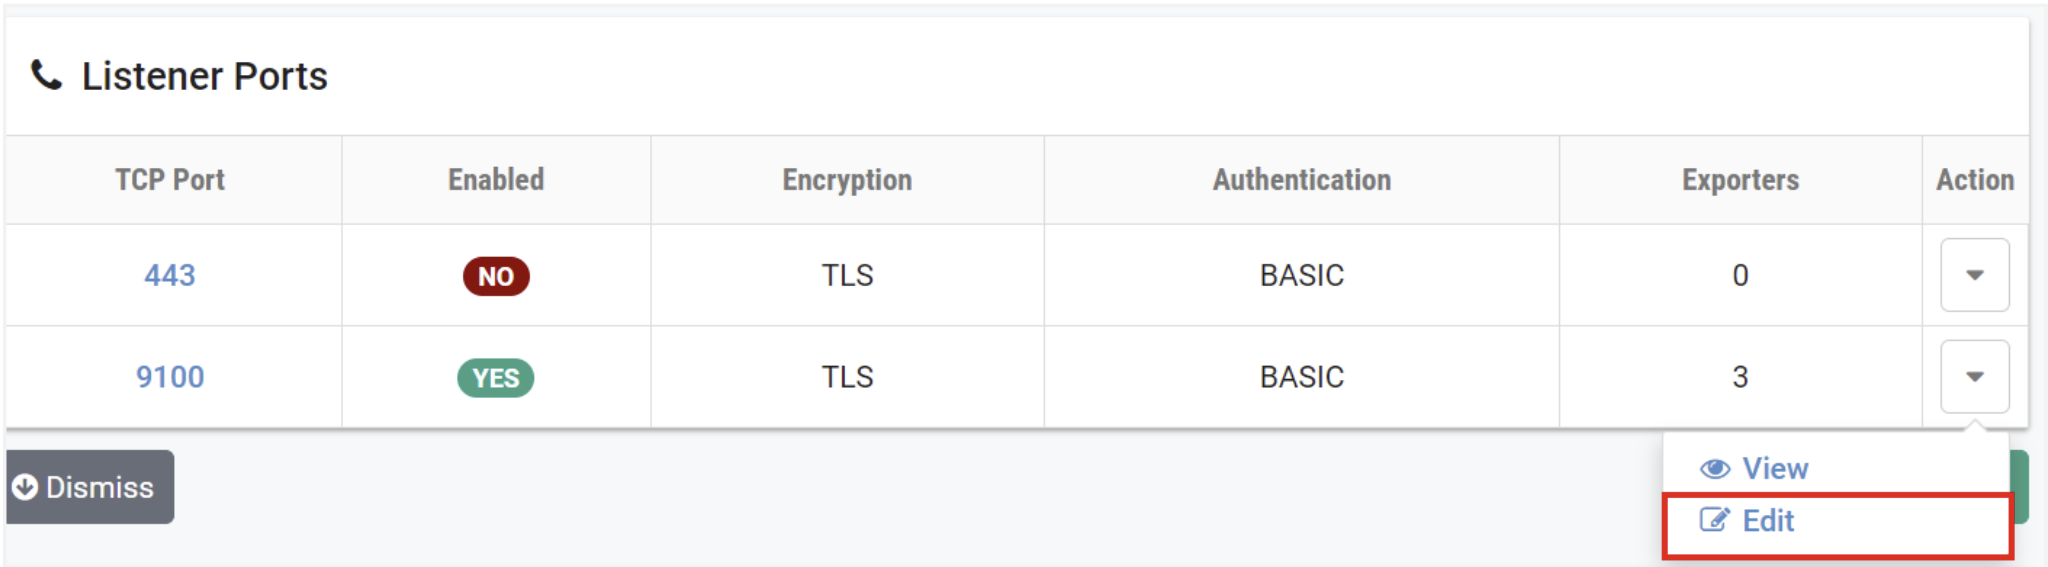
Go to Security > Admin > Prometheus Metrics.
To view the settings of a listener port, select the Action dropdown button on
the row on the Listener Ports table and select Edit.
The Listener Port Edit page will be displayed. Edit the values on the page as
appropriate (refer to the field descriptions below) and then click Submit. Select
and configure any additional exporters desired.
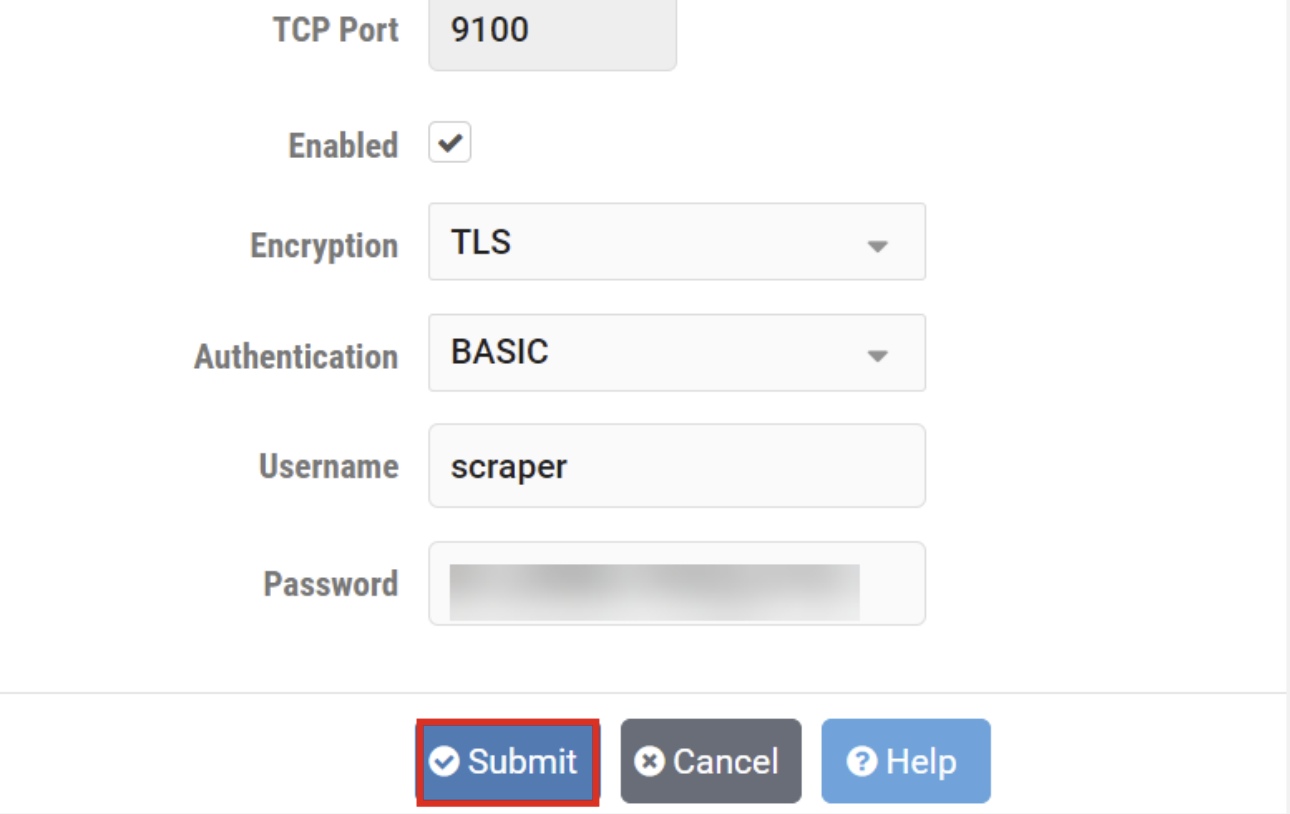
Field Descriptions – Edit Listener Port
- Enabled:
Check to enable this listener port. One or more exporters must be assigned to the port.
- Encryption:
Select the encryption type for this port.
- Authentication:
Type of authentication to use.
BASIC: Require username and password (recommended).
NONE: Disable authentication (not recommended).
- Username:
The username that must be sent by Prometheus to authenticate.
- Password:
The password that must be sent by Prometheus to authenticate. Password strength must comply with the system password policy.